

How the page measures up
A Metric chart or better known as a Waterfall, displays content it the same order it loads in your browser. As each item is loaded, you will see two colors on the timeline, green and dark gray. The green portion indicates the amount of wait time until the server responded, whereas the dark gray shows the amount of time it took to download. That amount is then combined and totaled into the Time column.
It can look a bit intimidating at first, but once you understand the basics, it easily becomes a very powerful tool. In addition, you can use it to get a broad range of information from load times, server response headers, files sizes, response times and progress bars.
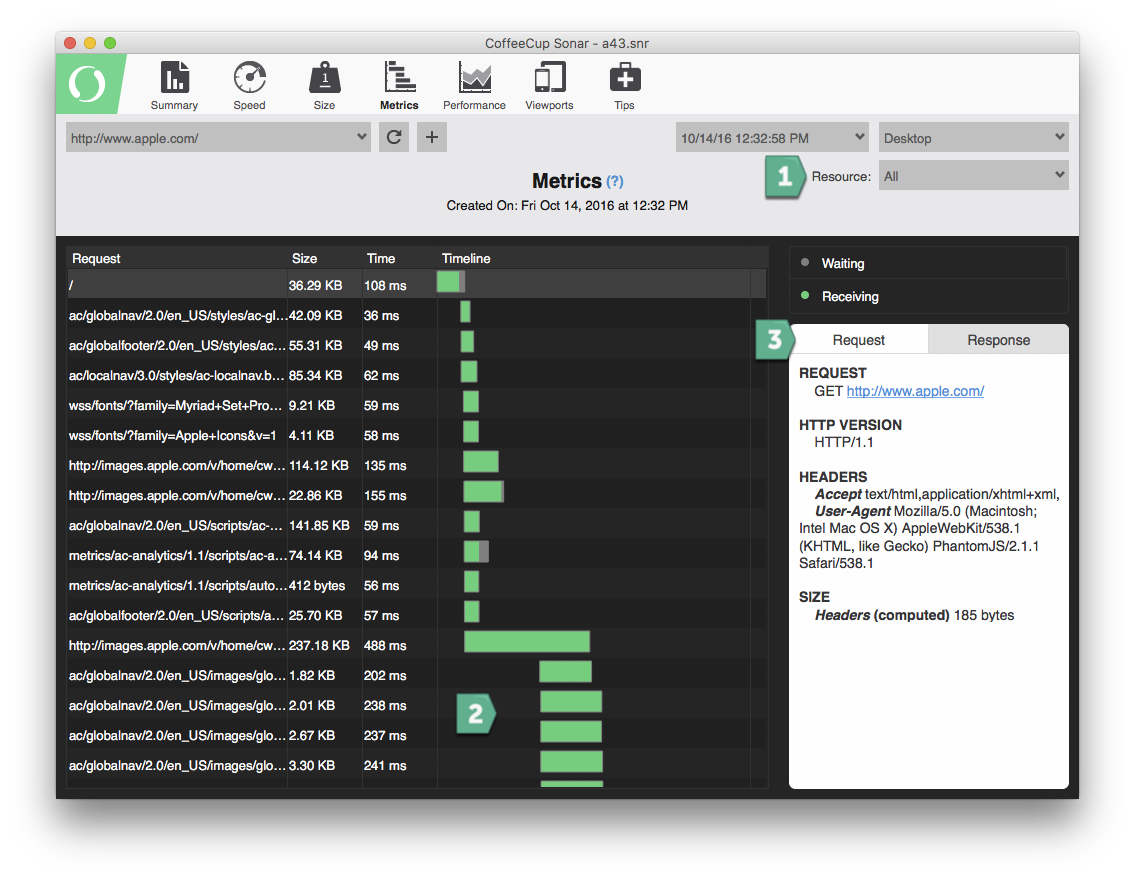
- Resources dropdown: Using the resources dropdown allows you to filter the waterfall chart by the file type. You can choose from HTML, JavaScript, CSS, images, flash, fonts, others.
- Waterfall chart: displays content it the same order it loads in your browser. For more information on the type of chart, click here.
- Response header information: This section provides information on what software is being used by your server to handle requests.