

CoffeeCup Sonar
Sonar is an app that provides insight on how well your site loads, then it provides tips on how to optimize and tune your site for better speeds!
Quick Links

 Metrics by File Size
 Metrics

Metrics by Speed
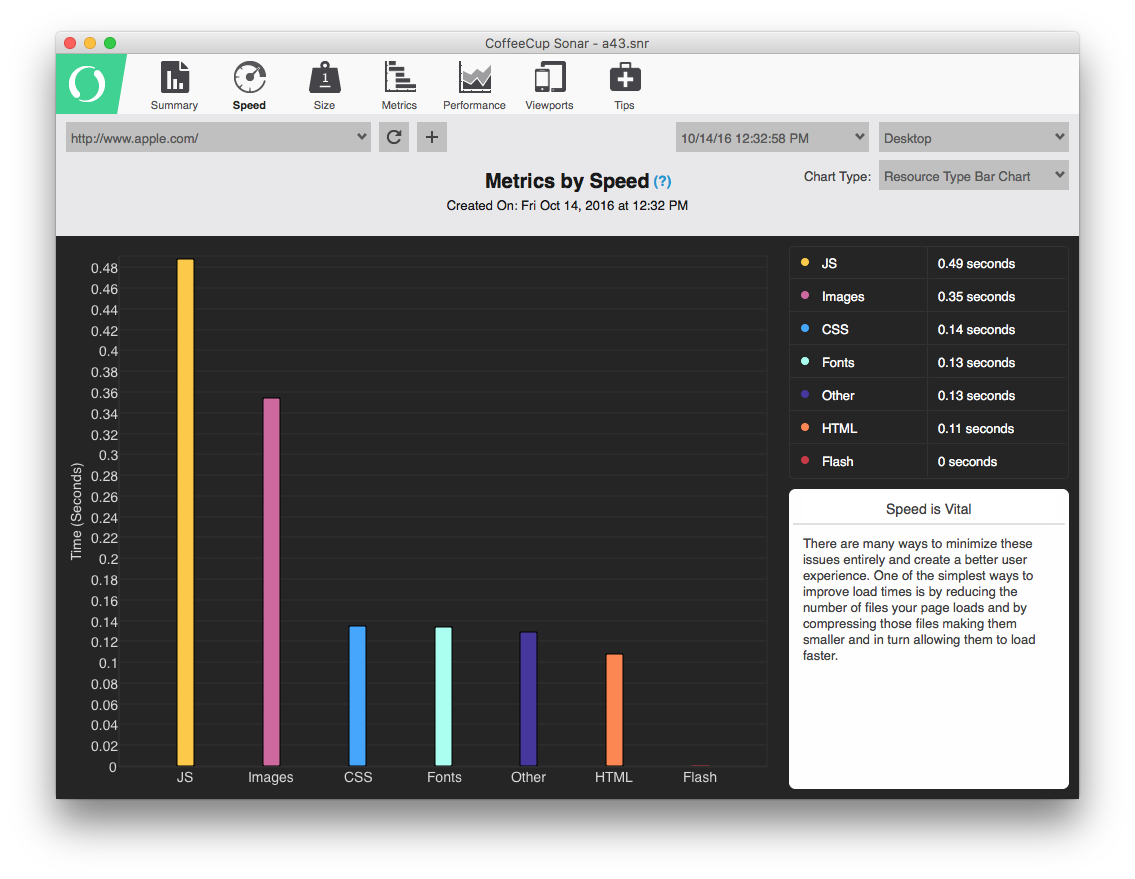
Knowing how content is loaded in your browser and seeing what takes the most time to download is an essential part of learning ways to speed up your website. Statistics show that nearly half of all web users have encountered slow page load times or worse, a websites that crashes their browser. Consumers want a speedy and an error free experience. Otherwise, you’ll risk them moving on to your neighbor’s site.
There are many ways to minimize these issues entirely and create a better user experience. One of the simplest ways to improve load times is by reducing the number of files your page loads and by compressing those files making them smaller and in turn allowing them to load faster.
Some links that maybe helpful in this case
- How Loading Time Affects Your Bottom Line
- How Slow is too slow
- Optimizing encoding and transfer size of text-based assets
Metrics by File Size
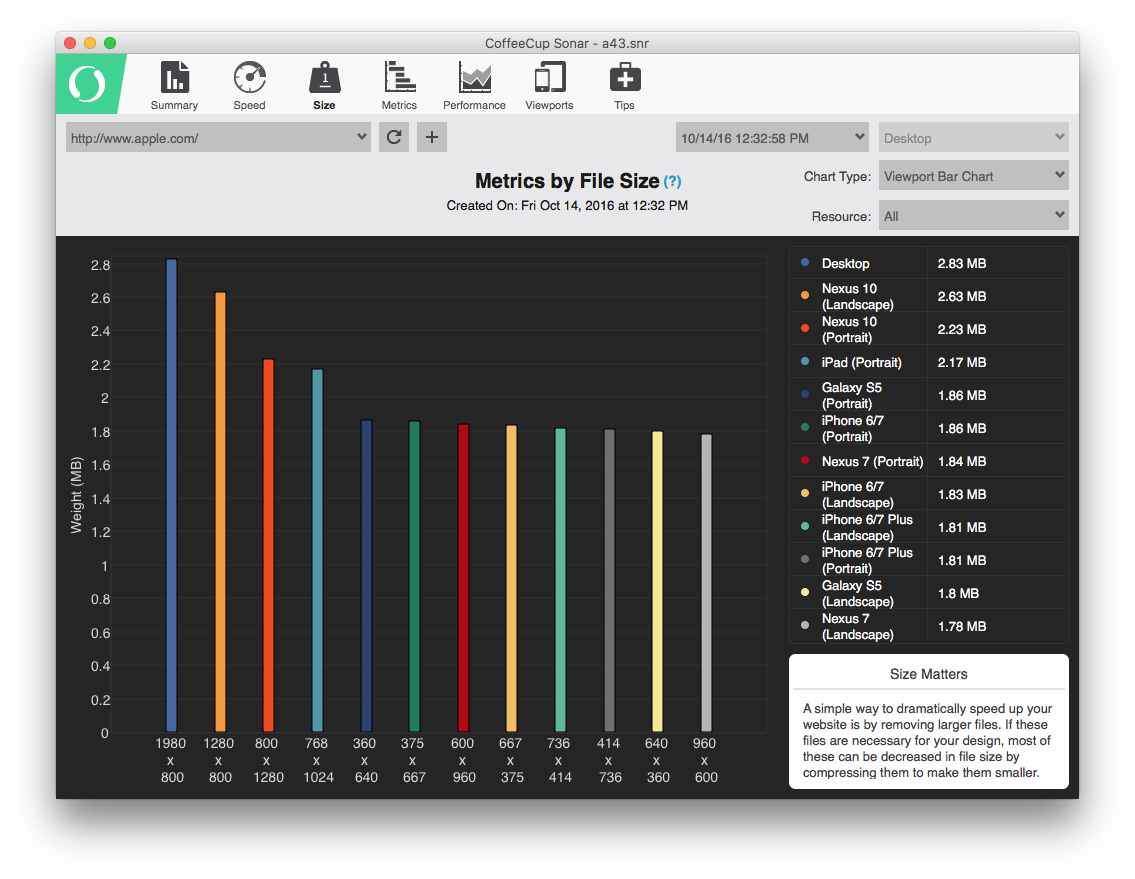
While similar to the Metrics By Speed chart, the Size pane instead focuses on the actual file size. Having large file sizes not only slows down the loading of your page but significantly impacts user experience. Slower sites will almost always cause users to bail for faster loading ones.
A simple way to dramatically speed up your website is to start by removing larger files. If these files are mandatory, most images can decrease in file size by compressing them to make them smaller. Similarly, HTML and CSS files can also be compressed by removing unneeded characters such as spaces and line breaks..
Some links that maybe helpful in this case
- Image Compression for Web Developers
- Website Insight File Compression App (for Windows)
- A Brief History of Web Page Size
- Guidelines for determining web page and file size
Metrics
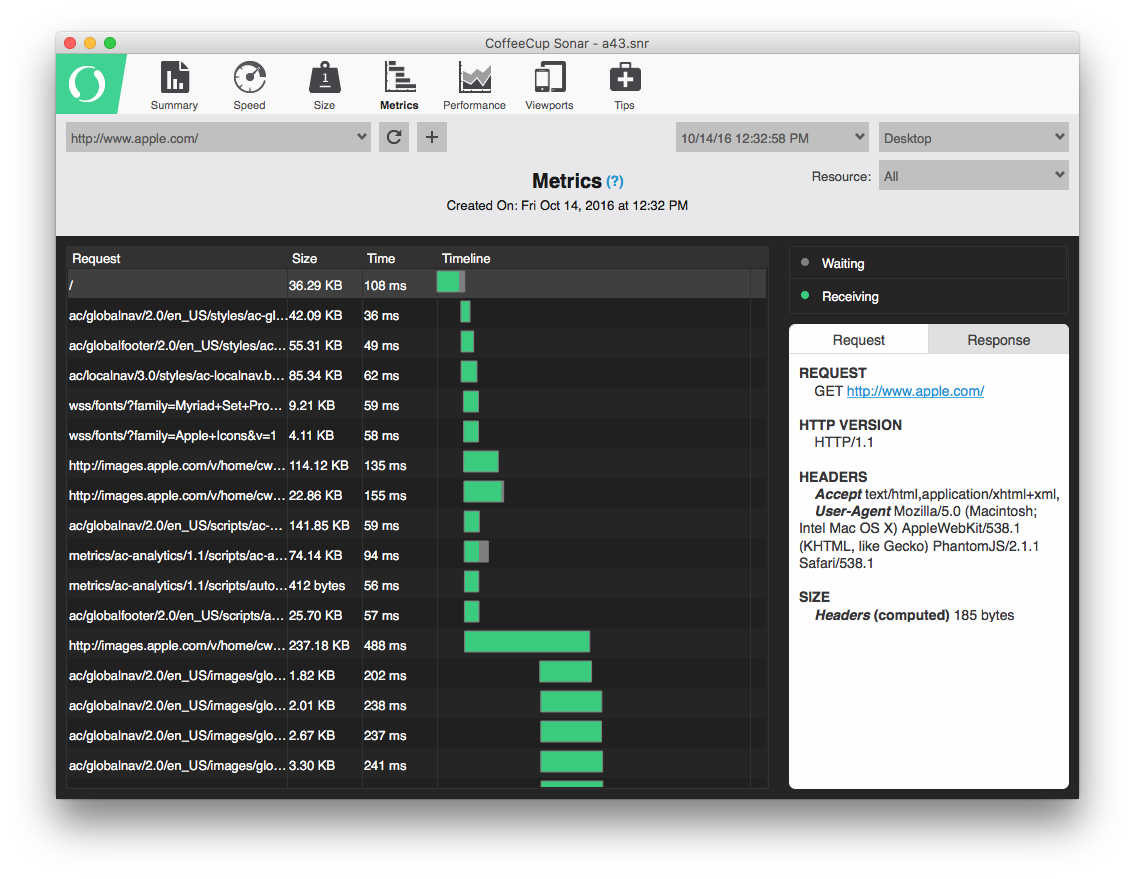
A Metric chart or better known as a Waterfall, displays content it the same order it loads in your browser. As each item is loaded, you will see two colors on the timeline, green and dark gray. The green portion indicates the amount of wait time until the server responded, whereas the dark gray shows the amount of time it took to download. That amount is then combined and totaled into the Time column.
It can look a bit intimidating at first, but once you understand the basics, it easily becomes a very powerful tool. In addition, you can use it to get a broad range of information from load times, server response headers, files sizes, response times and progress bars.
Some links that maybe helpful in this case
- Firebug Net Panel Timings
- Waterfalls 101: How to use a waterfall chart to diagnose your website’s performance pains
- A Brief History of Web Page Size
History of Performance
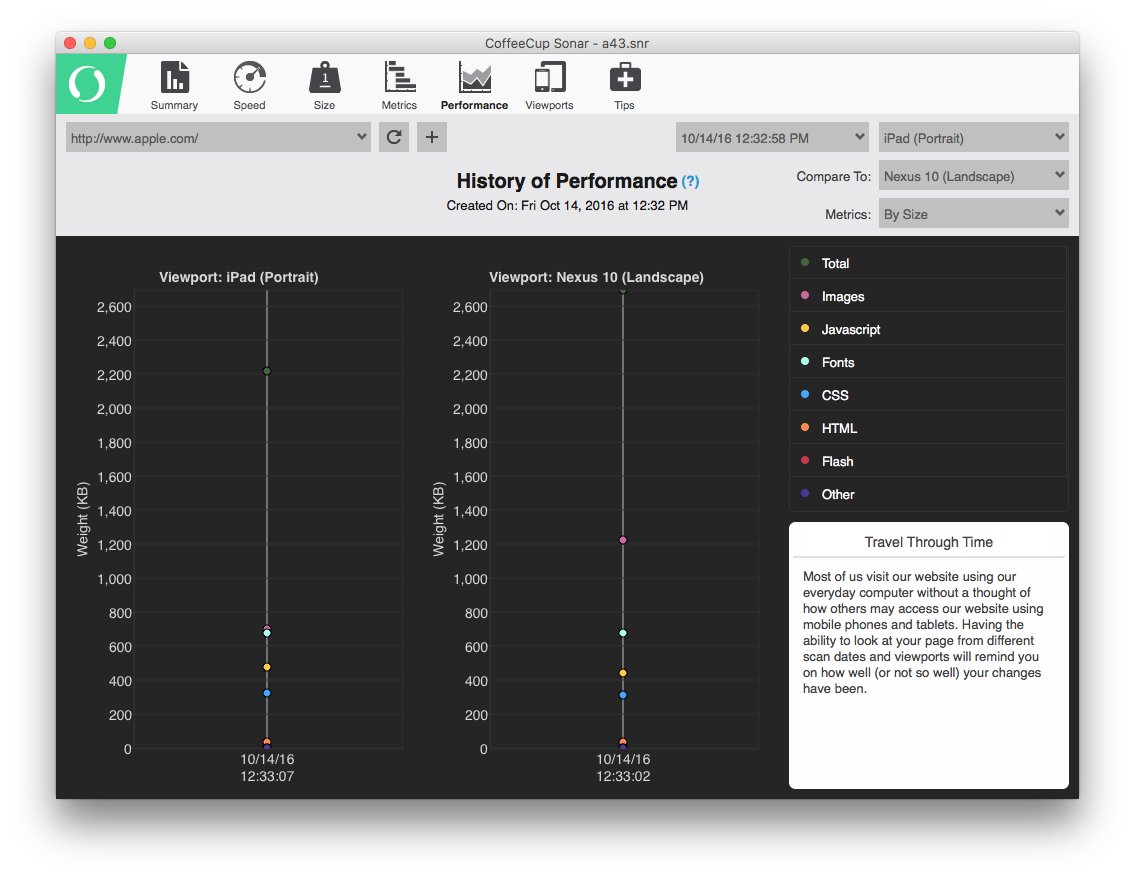
Knowing how your website performs today is equally as important to see how it performs over a period of time. Not only can you see how your site behaved on a particular date, but you can also compare how it behaved on a particular viewport compared to other viewports on that date. Many changes are made to improve your website which many forget the subtle differences between modifications.
Why is this important? Most of us visit our website using our everyday computer without a thought of how others may access your website using mobile phones and tablets. Having the ability to look at your page from different scan dates and viewports will remind you on how well (or not so well) your changes have been.
Some links that maybe helpful in this case
Other Resources
Here are a few resource links that help explain some of the topics covered within the Tips & Recommendations.